
financial advice

First Half 2026 Market Update: Earnings Drive the Rally

Despite elevated interest rates, concerns over sticky inflation, geopolitical uncertainty, and pricy valuations, the S&P 500 has continued to push toward new highs, closing the second quarter up 10.2% year-to-date.[1] Understandably, many investors are asking whether the market has gotten ahead of itself.


It seems the recent rally has been supported by something more durable than investor optimism. It's been exceptional corporate profitability. It's worth understanding what's actually driving that trend.

Earnings Growth: A Historic Run

According to FactSet’s most recent Earnings Insight (June 26, 2026), the S&P 500 is on track to report year-over-year earnings growth of 23.1% for the second quarter of 2026.[2] If that holds, it will be the second consecutive quarter of earnings growth above 20% and the seventh straight quarter of double-digit growth. For context, this is well above both the five-year average earnings growth rate is 16.4% and the ten-year average is just 10.3%.

Equally notable: analysts have been raising estimates during the quarter, not cutting them. Historically, estimates fall roughly 2–3% through a quarter as caution sets in. This quarter, they have risen by 3.4% since March 31, when the consensus stood at 18.8%. That kind of positive revision is unusual and reflects genuine earnings momentum.


Elevated Valuations—and Why They May Be Justified

With markets having rallied sharply, price-to-earnings ratios are elevated relative to historical norms. This is a legitimate concern worth acknowledging. However, high valuations are more defensible when earnings growth is this robust.

The forward picture supports this view. Analysts project full-year 2026 earnings growth of 24.0% and further growth of 16.8% in 2027. The forward 12-month P/E ratio of 20.1 is above both the 5-year average of 19.9 and the 10-year average of 19.0—elevated, but not dramatically so given the earnings trajectory. If those estimates prove reasonable, much of today’s premium compresses naturally as earnings rise to meet current prices. That is a very different situation from a bubble built on hope rather than results.

Profit Margins at Record Levels

A key reason for this growth is improving profit margins. The estimated net profit margin for the S&P 500 in Q2 2026 is 14.2%—which would be the second-highest on record since FactSet began tracking this figure in 2009.[3] The only quarter to exceed it was Q1 2026 at 14.8%. The five-year average is 12.3%. Companies are growing revenues and keeping more of each dollar as profit.
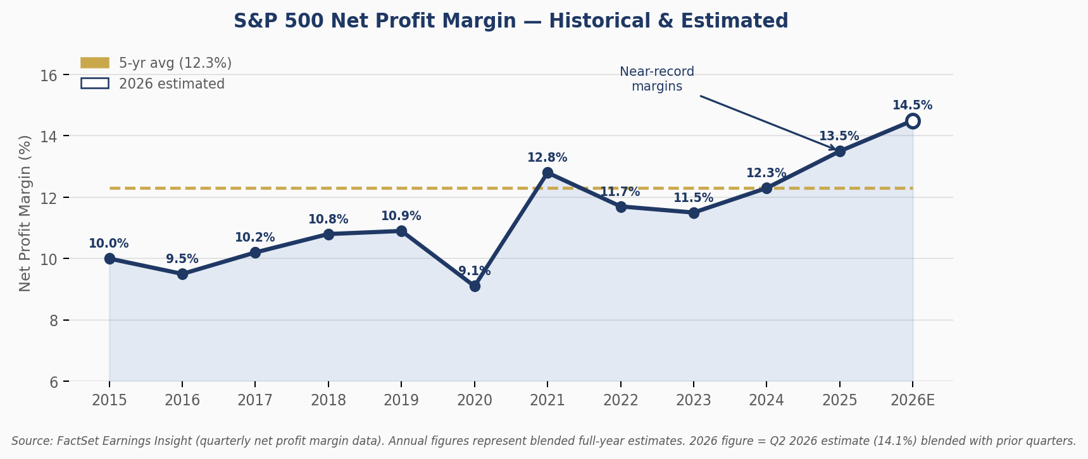
 

Figure 1: S&P 500 Net Profit Margin, 2015–2026E. Sources: FactSet Earnings Insight (quarterly reports). 2026 reflects Q2 2026 estimate blended with prior quarters.

It is worth pausing to ask what is actually driving these record margins. Revenues are growing at 12.3%, but earnings are growing at 23.1%. That gap has to come from somewhere, and it is coming from labor—the one cost that has not kept pace with output.

The productivity data reinforces this point. U.S. nonfarm business labor productivity grew 3.0% in 2024 and 2.2% in 2025—both well above the ten-year historical average of roughly 1.5%.[4][5] Output is expanding faster than hours worked as evidenced by the chart below.
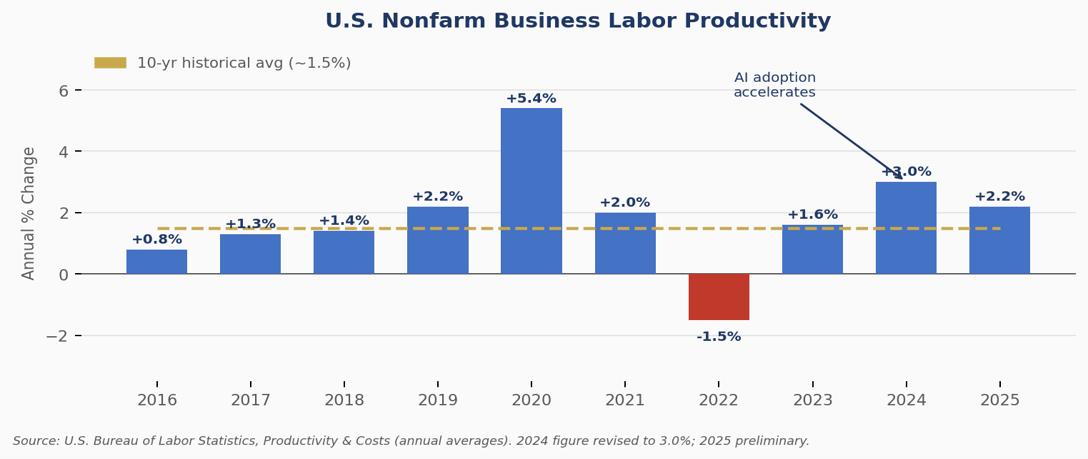
Figure 2: U.S. Nonfarm Business Labor Productivity, Annual % Change, 2016–2025. Source: U.S. Bureau of Labor Statistics, Productivity & Costs.

Critically, this margin story has so far been concentrated in technology. Apollo’s chief economist published analysis earlier this year showing that over the past 20 years, essentially all of the increase in the S&P 500’s operating margin has come from tech-related sectors, while operating margins for the rest of the index have stayed near 9%—roughly flat for two decades.[6] Strip out technology, and the headline margin picture looks considerably more ordinary.


The Next Phase: AI Broadening Beyond Tech

The question worth asking now is whether these gains will spread beyond technology. The early evidence says yes, though unevenly: adoption is already broad, but measurable financial payoff is still concentrated in a narrower set of use cases and companies. On the adoption side, roughly 37% of U.S. companies with 250 or more employees now use AI in their operations, and more than 40% of American workers report using generative AI on the job[7]—adoption that has happened in roughly three years. In financial services, JPMorgan puts the value from AI at roughly $1.5 billion, spanning fraud detection, trading, and back-office efficiency.[8] A March 2026 NBER study of nearly 750 executives confirms positive productivity gains across sectors, with the strongest near-term effects in services and finance.[9]

That said, a PwC survey found 56% of CEOs have yet to see measurable revenue or cost impact from their AI investments.[10] BlackRock’s equity team describes the list of companies with tangible AI-driven margin improvement as “small but growing.”[11] Goldman Sachs estimates AI could add roughly 1.5 percentage points to annual U.S. productivity growth over the next decade.[12] If non-tech margins move even modestly off their long-standing 9% floor, the companies leading that shift will be worth owning.


Portfolio Positioning

As this AI led productivity trend plays out, we remain constructive on equities and have maintained meaningful exposure to large-cap growth and technology. At the same time, we are watching closely for evidence of AI-driven margin improvement spreading into non-tech sectors. The speed of the recent rally warrants discipline on valuation, and we continue to monitor macroeconomic risks that could disrupt the earnings trajectory.


Advisory services offered through APG Capital Asset Management, a Member of Advisory Services Network, LLC. All views/opinions expressed are solely those of the author and do not reflect the views/opinions held by Advisory Services Network, LLC. The information herein is of a general nature and is intended for educational purposes only. This material does not constitute a recommendation or solicitation for the purchase or sale of securities. Past performance does not guarantee future results. See footnotes for full source citations.


[1]S&P 500 total return of 10.2% year-to-date through market close on June 30, 2026 (price return of 9.6%, dividend return of 0.7%). Source: S&P Dow Jones Indices data, as compiled by Slickcharts, "S&P 500 Year to Date Return." https://www.slickcharts.com/sp500/returns/ytd

[2]FactSet, "Earnings Insight," June 26, 2026. https://advantage.factset.com/hubfs/Website/Resources%20Section/Research%20Desk/Earnings%20Insight/EarningsInsight_062626.pdf

[3]FactSet Earnings Insight, June 26, 2026: Q2 2026 estimated net profit margin 14.2%, second-highest on record since 2009. Record was 14.8% in Q1 2026. Five-year average: 12.3%. IT sector estimated margin: 30.7% vs. 5-year average of 25.3%.

[4]U.S. Bureau of Labor Statistics, "Productivity and Costs — Annual Averages 2025, Revised," March 5, 2026. https://www.bls.gov/news.release/archives/prod2_03052026.htm

[5]U.S. Bureau of Labor Statistics, "Productivity up 2.3 percent in 2024," The Economics Daily, February 12, 2025. https://www.bls.gov/opub/ted/2025/productivity-up-2-3-percent-in-2024.htm

[6]Torsten Sløk, Apollo Chief Economist, "S&P 500 Margin Expansion All Coming from Tech," Apollo Academy, January 25, 2026. https://www.apolloacademy.com/sp-500-margin-expansion-all-coming-from-tech/

[7]Commonfund, "AI’s Productivity Payoff Is Here," June 18, 2026. https://www.commonfund.org/blog/ais-productivity-payoff-is-here

[8]JPMorgan Chase management commentary, Q4 2025 earnings call; cited in Investing.com, "JPMorgan Chase AI Spending Targets Cost Savings and Margin Gains," April 8, 2026. https://www.investing.com/analysis/jpmorgan-chase-ai-spending-targets-cost-savings-and-margin-gains-200678084

[9]Baslandze et al., "Artificial Intelligence, Productivity, and the Workforce: Evidence from Corporate Executives," NBER Working Paper 34984, March 2026. https://www.nber.org/papers/w34984

[10]PwC CEO Survey 2026, cited in Svitla Systems, "AI ROI and Cost Optimization in 2026," May 2026. https://svitla.com/blog/ai-roi-and-cost-optimization-in-2026/

[11]BlackRock Fundamental Equities, "Choosing Stocks Outside the Magnificent 7," February 2026. https://www.blackrock.com/us/individual/insights/stock-investing-outside-the-magnificent-seven

[12]Goldman Sachs Research, cited in Commonfund, "AI’s Productivity Payoff Is Here," June 18, 2026. Goldman estimates generative AI could lift U.S. productivity by ~1.5 percentage points annually over the coming decade.

How "Top Gun" Can Help You Position Your Portfolio when the Yield Curve Inverts

Maverick: “We Were Inverted”


During the iconic Tom Cruise scene in Top Gun when he details his interaction with a Russian MIG during a test flight, he explains to a shocked room (not before he removes the cool shades), that the way he was able to see the MIG while flying above it, was that “We were inverted.”  This week, in a shock to the market, the 5-year minus 2-year yield was negative, or “inverted”.  Usually, the longer the duration, the higher the yield; however, short-term interest rates are currently higher.  A more common tracked metric is the 10-year minus 2-year yield which is close to inverting as seen below.

fredgraph (1).png

There are several reasons why this is occurring.  The Fed (which controls short term rates) is witnessing strong domestic growth and an upward creep in core inflation.   Since interest rate changes can take time to move through the economy, the Fed preemptively will move to limit anticipated problems, i.e. runaway inflation.   By increasing rates, they can put the brakes on growth limiting inflation.  It also gives the Fed room to move rates lower if the economy slips.  On the other hand, the market (investors and traders) determines the rest of the interest rate curve.  Currently, the market has a strong demand for longer duration bond for the relative safety of government bonds due to a combination of fear of market volatility and an outlook that the Fed may have to lower rates in the coming years.

What are the implications of an inverted curve? All seven recessions since 1970 have been heralded by a yield curve inversion.  However not all inversions imply a recession.  Tom Lee, the co-founder of Fundstrat Global Advisors LLC, calculates that the 3- to 5-year yield inversion has occurred 73 times since 1954 while the economy endured only nine recessions. “5Y-3Y inversion predicted 73 of the last 9 recessions, too many false positives.”[i]

Now the question is: “What are investors to do about this?”  It really all depends on your risk appetite, holding period and allocation. While market weakness is not a guarantee, there are strong indications, like the higher VIX index, the market will be more volatile going forward.  Investors need to know how they are positioned to ensure their allocations are aligned with their capacity for risk.  At my firm, we use Riskalyze’s risk alignment software to make sure we know how much risk our clients are willing to take and to position their portfolios accordingly.  First, we determine your “Risk Number” though a short survey.  Then we analyze your current portfolio of securities to see how risky your portfolio is.  If you are interested in this, or just curious what your risk number is, click here for a short survey and check out more on Riskalyze here


[i] https://www.bloomberg.com/news/articles/2018-12-06/history-shows-inverted-yield-curve-is-no-death-knell-for-s-p-500

Advisory services offered through APG Capital Asset Management, a Member of Advisory Services Network, LLC.

Phone: 713-446-3233  Website: www.apgcap.com

All views/opinions expressed in this newsletter are solely those of the author and do not reflect the views/opinions held by Advisory Services Network, LLC. Indexes are unmanaged and do not incur management fees, costs, or expenses.  It is not possible to invest directly in an index.  The information and material contained herein is of a general nature and is intended for educational purposes only.  This material does not constitute a recommendation or a solicitation or offer of the purchase or sale of securities.  The future performance of an investment or strategy cannot be deduced from past performance.  As with any investment or investment strategy, the outcome depends upon many factors including: investment objectives, income, net worth, tax bracket, risk tolerance, as well as economic and market factors.  All economic and performance data is historical and not indicative of future results.  All information contained herein is derived from sources deemed to be reliable but cannot be guaranteed.

 Estate Planning is Not All About the Estate Tax

When most people hear about estate planning, they may remember the $11 million estate tax limit and figure it is irrelevant for their situation.  However, estate planning is not only for ultra-high net worth families.  Careful consideration and planning are important for all individuals and families with handling their end of life legacies.  Here are three scenarios where planning would help insure your estate goals such as protecting privacy, minimizing costs and taxes and ensuring assets are going to the intended beneficiaries.


First of all, the probate process is very public.  A quick search in county records of a deceased person’s name, like this, will pull up court filings with assets, motions and rulings.  This public disclosure can be avoided with the use of a revocable living trust and a pour-over trust.  Proper titling of assets and updating your account beneficiaries can also be helpful.


Another example covers instances when families own property in another state, as the probate process is not limited to the state of your residence.  In fact, there will be probate in each state where the decendent owned property with all the associated court costs and hassles.   Careful titling of the property can avoid this by using a trust vehicle or “joint tenants with right of survivorship.”


The last example is settling an estate with a family-owned business.  In these instances, there are several tricky problems that can arise.  For example, how do you split the ownership if only one of the children is involved in running the business. It may make splitting assets easier to leave the business to that child and then have a live insurance policy that benefits the other children that equalizes the value. Another way that life insurance may help is if much of the assets of the decedent is tied up in the business. Any estate taxes or other cash needs can be handled without having to sell some, or all, of the business.


Your estate planning needs evolve over time.  While no substitute for an estate attorney in drafting wills and setting up trusts, a trusted advisor who understands the changes in your life can help navigate some of these issues and recognize when a lawyer is needed.


Advisory services offered through APG Capital Asset Management, a Member of Advisory Services Network, LLC.

Phone: 713-446-3233  Website: www.apgcap.com

All views/opinions expressed in this newsletter are solely those of the author and do not reflect the views/opinions held by Advisory Services Network, LLC. Indexes are unmanaged and do not incur management fees, costs, or expenses.  It is not possible to invest directly in an index.  The information and material contained herein is of a general nature and is intended for educational purposes only.  This material does not constitute a recommendation or a solicitation or offer of the purchase or sale of securities.  The future performance of an investment or strategy cannot be deduced from past performance.  As with any investment or investment strategy, the outcome depends upon many factors including: investment objectives, income, net worth, tax bracket, risk tolerance, as well as economic and market factors.  All economic and performance data is historical and not indicative of future results.  All information contained herein is derived from sources deemed to be reliable but cannot be guaranteed.

APG Capital Asset Management First Half 2018 Review and Outlook

Hope everyone is enjoying their summer.  We are returning from some time in Cape Cod.  Always great to step back from the day-to-day grind, recharge, and reflect on goals and aspirations.  As this marks the one-year anniversary of APG Capital, it is also a time of thanks to those who have supported me with their trust and encouragement. 

Budgeting for these breaks from life are important too.  Having some cushion in your retirement plans for the carefree “we’re on vacation” spending that may otherwise trigger a second thought.  Needless to say, we did not splurge on the $185,000/week yacht we saw moored in Nantucket!

After a volatile 1st quarter, the US market calmed a bit in the 2nd Quarter as the S&P 500 rallied 3.4%.  It is now up 2.6% at the halfway point of the year[i].  Within the broader indexes, technology and growth companies continued to be the standouts along with a recent rally in small cap stocks. 

International equities have been a drag on returns, especially emerging market stocks, which have been impacted by the escalating tariffs and trade wars.  Without the impact of tariffs affecting international trade, markets should perform very well this year with a backdrop of good growth, fiscal stimulus, and reasonable valuations.  Much what you learn in business school can be distilled into “tax cuts -  good, tariffs - bad”.  The US should be careful about inciting a trade war with China as trade with the Asian countries is responsible for much of the tame inflation we’ve enjoyed, and their growing middle-class is demanding more of our exports.  In addition, our large budget deficits and the current unwinding of our quantitative easing policies, require large buyers for our bond sales.  China has been that buyer and without that bid, interest rates could go much higher.  Hopefully, free market capitalists within the administration will prevail and talk of a trade war will be bluff and bluster.  That said, bringing international exposures down, might be prudent.   

On the fixed income front, the benchmark 10-year bond seems to be range-bound between 2.8%-3.0% [ii].  With the Fed continuing to raise rates, the yield curve continues to flatten.  It seems like the better risk/reward payoff is reaching a bit on credit risk versus duration risk. Therefore, it makes sense to continue favoring short-term, high-yield bonds and bank loans.

Enjoy your summer.

Safe travels.


Adam Gross


Advisory services offered through APG Capital Asset Management, a Member of Advisory Services Network, LLC.

Phone: 713-446-3233  Website: www.apgcap.com

All views/opinions expressed in this newsletter are solely those of the author and do not reflect the views/opinions held by Advisory Services Network, LLC. Indexes are unmanaged and do not incur management fees, costs, or expenses.  It is not possible to invest directly in an index.  The information and material contained herein is of a general nature and is intended for educational purposes only.  This material does not constitute a recommendation or a solicitation or offer of the purchase or sale of securities.  The future performance of an investment or strategy cannot be deduced from past performance.  As with any investment or investment strategy, the outcome depends upon many factors including: investment objectives, income, net worth, tax bracket, risk tolerance, as well as economic and market factors.  All economic and performance data is historical and not indicative of future results.  All information contained herein is derived from sources deemed to be reliable but cannot be guaranteed.


[i]http://performance.morningstar.com/funds/etf/total-returns.action?t=SPY&region=USA&culture=en_US


[ii] https://quotes.wsj.com/bond/BX/TMUBMUSD10Y

Do Traders Need A Financial Advisor?

Why would a commodity trader, a master of buying and selling some of the most volatile markets need to hire someone to help manage their wealth? Actually, there are some very good reasons an independent advisor can benefit you and your family in the long run:

Focus on What You Know: With a demanding profession, the burden of managing your assets may be a secondary concern. With an independent advisor, you are hiring a fiduciary who is looking out for your best interests.  An effective advisor will construct and manage a portfolio consistent with your objectives, allowing you to focus on the markets that should matter most—the ones you are trading—without worrying that your long term goals are at risk.

Harmful Myopia and Impulse Trading: While you are focused on your particular market, it is easy to extrapolate the fundamentals of your niche to the broader markets, even when that correlation may not exist, thus clouding your judgment. This may lead to rash “dump it all” or “buy everything” moves in your portfolio. Instinctual moves may be appropriate for your trading book, but may do irreparable harm to your longer term goals of paying for your children’s college and funding your retirement.

Make Lemonade from Lemons: With a volatile-earnings profession, there are tactics you can employ to take advantage of your lumpy income. For example, during low earnings years, consider Roth IRA conversions or opportunistically take long term capital gains on appreciated assets. On the flip-side, in high income years consider contributing to a Donor Advised Fund to lower your taxable income.

Separating the goals and risk profile of your job from that of your general overall wealth is critically important. Hiring a professional wealth manager for the bulk of your nest egg makes a lot of sense, for both your peace of mind and your wallet.